How to configure Prometheus monitoring server with Grafana 6 on Ubuntu 22.04
Installing Prometheus monitoring server
-
This article will instruct you on configuring the Prometheus Monitoring Server with Grafana 6.
-
Grafana should be installed in the system before start with this steps.
- First we need prepare Environment, To run Prometheus safely on our server, we have to create a user for Prometheus and Node Exporter.
sudo useradd --no-create-home --shell /usr/sbin/nologin prometheus
sudo useradd --no-create-home --shell /bin/false node_exporter- Create the folders required to store the binaries of Prometheus and its configuration files.
sudo mkdir /etc/prometheus
sudo mkdir /var/lib/prometheus- Set the ownership of these directories to our prometheus user, to make sure that Prometheus can access to these folders.
sudo chown prometheus:prometheus /etc/prometheus
sudo chown prometheus:prometheus /var/lib/prometheus- Download the latest version of Node Exporter.
wget https://github.com/prometheus/node_exporter/releases/download/v0.16.0/node_exporter-0.16.0.linux-amd64.tar.gz- Unpack the downloaded archive. This will create a directory node_exporter-0.16.0.linux-amd64, containing the executable, a readme and license file.
tar xvf node_exporter-0.16.0.linux-amd64.tar.gz- Copy the binary file into the directory /usr/local/bin and set the ownership to the user you have created in step previously.
sudo cp node_exporter-0.16.0.linux-amd64/node_exporter /usr/local/bin
sudo chown node_exporter:node_exporter /usr/local/bin/node_exporter- Remove the leftover files of Node Exporter, as they are not needed any longer.
rm -rf node_exporter-0.16.0.linux-amd64.tar.gz node_exporter-0.16.0.linux-amd64- To run Node Exporter automatically on each boot, a Systemd service file is required. Create the following file by opening it in Nano:
sudo nano /etc/systemd/system/node_exporter.service- Copy the following information in the service file, save it and exit Nano.
[Unit]
Description=Node Exporter
Wants=network-online.target
After=network-online.target

[Service]
User=node_exporter
Group=node_exporter
Type=simple
ExecStart=/usr/local/bin/node_exporter

[Install]
WantedBy=multi-user.target- Reload Systemd to use the newly defined service
sudo systemctl daemon-reload- Run Node Exporter by typing the following command.
sudo systemctl start node_exporter- Verify that the software has been started successfully:
sudo systemctl status node_exporter- You will see an output like this

- If everything is working, enable Node Exporter to be started on each boot of the server.
sudo systemctl enable node_exporter- Download and Unpack Prometheus latest release of Prometheus. As exemplified, the version is 2.2.1.
sudo apt-get update && apt-get upgrade
wget https://github.com/prometheus/prometheus/releases/download/v2.2.1/prometheus-2.2.1.linux-amd64.tar.gz
tar xfz prometheus-*.tar.gz
cd prometheus-*- Copy the binary files into the /usr/local/bin/directory
sudo cp ./prometheus /usr/local/bin/
sudo cp ./promtool /usr/local/bin/- Set the ownership of these files to the prometheus user previously created.
sudo chown prometheus:prometheus /usr/local/bin/prometheus
sudo chown prometheus:prometheus /usr/local/bin/promtool- Copy the consoles and console_libraries directories to /etc/prometheus.
sudo cp -r ./consoles /etc/prometheus
sudo cp -r ./console_libraries /etc/prometheus- Set the ownership of the two folders, as well as of all files that they contain, to our prometheus user.
sudo chown -R prometheus:prometheus /etc/prometheus/consoles
sudo chown -R prometheus:prometheus /etc/prometheus/console_libraries- In our home folder, remove the source files that are not needed anymore
cd .. && rm -rf prometheus-*- Open the file prometheus.yml in a text editor.
sudo nano /etc/prometheus/prometheus.yml- File should look like this example:
global:
  scrape_interval:     15s
  evaluation_interval: 15s

rule_files:
  # - "first.rules"
  # - "second.rules"

scrape_configs:
  - job_name: 'prometheus'
    scrape_interval: 5s
    static_configs:
- targets: ['localhost:9090']- Set the ownership of the file to our Prometheus user
sudo chown prometheus:prometheus /etc/prometheus/prometheus.yml- Start running Prometheus by using following command.
sudo -u prometheus /usr/local/bin/prometheus --config.file /etc/prometheus/prometheus.yml --storage.tsdb.path /var/lib/prometheus/ --web.console.templates=/etc/prometheus/consoles --web.console.libraries=/etc/prometheus/console_libraries- The server starts displaying multiple status messages and the information that the server has started:
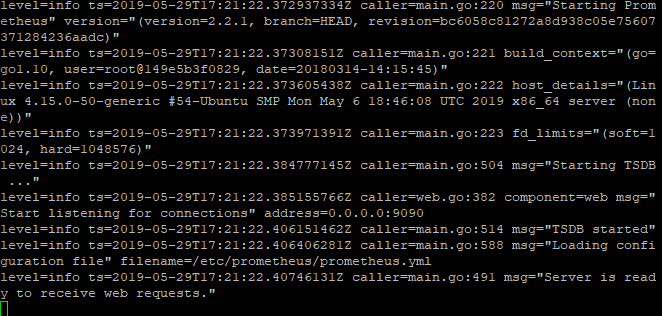
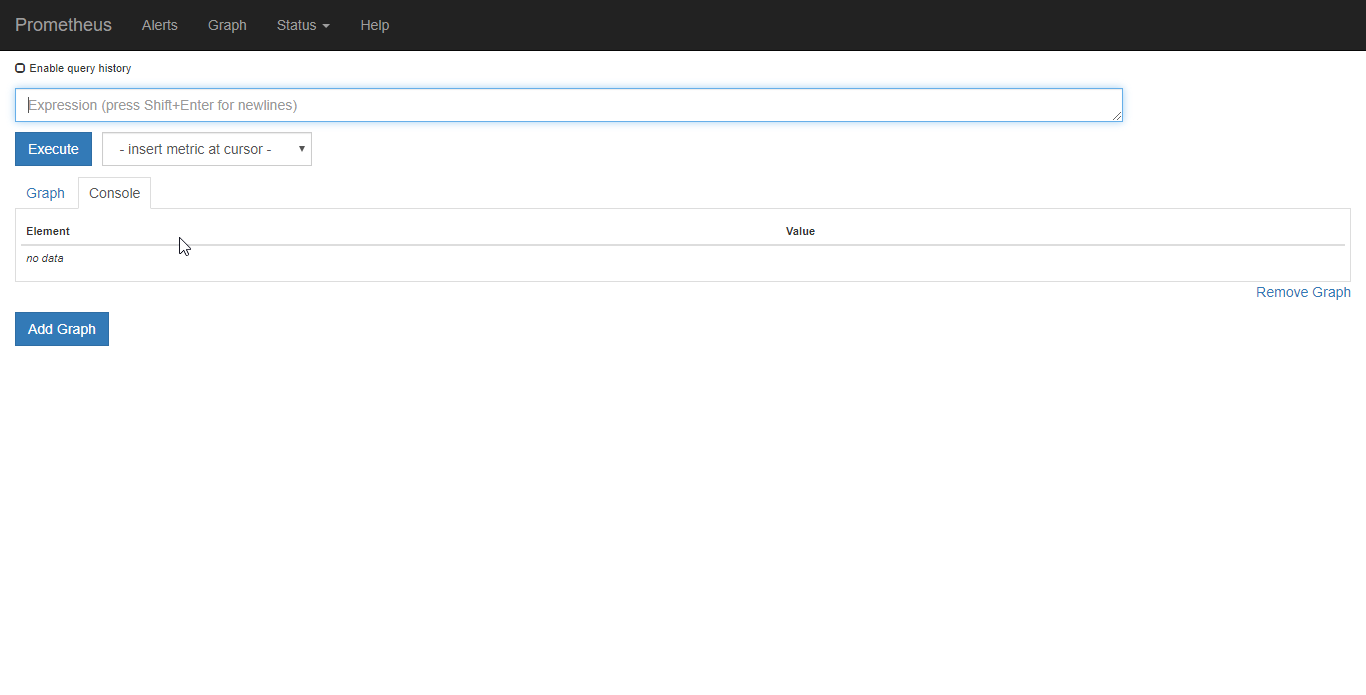
- Open your browser and type http://IP.OF.YOUR.SERVER:9090 to access the Prometheus interface.If it is working end task by pressing Ctrl+C./
web interface will look this
- The server is working now, but it can not be launched automatically at boot, create a new systemd configuration file that will tell your OS which services should it launch automatically during the boot process.
sudo nano /etc/systemd/system/prometheus.service- Copy the following information in the file and save it, then exit the editor
[Unit]
  Description=Prometheus Monitoring
  Wants=network-online.target
  After=network-online.target

[Service]
  User=prometheus
  Group=prometheus
  Type=simple
  ExecStart=/usr/local/bin/prometheus \
  --config.file /etc/prometheus/prometheus.yml \
  --storage.tsdb.path /var/lib/prometheus/ \
  --web.console.templates=/etc/prometheus/consoles \
  --web.console.libraries=/etc/prometheus/console_libraries
  ExecReload=/bin/kill -HUP $MAINPID

[Install]
WantedBy=multi-user.target- To use the new service, reload the system and enable prometheus
sudo systemctl daemon-reload
sudo systemctl enable prometheus- Start Prometheus.
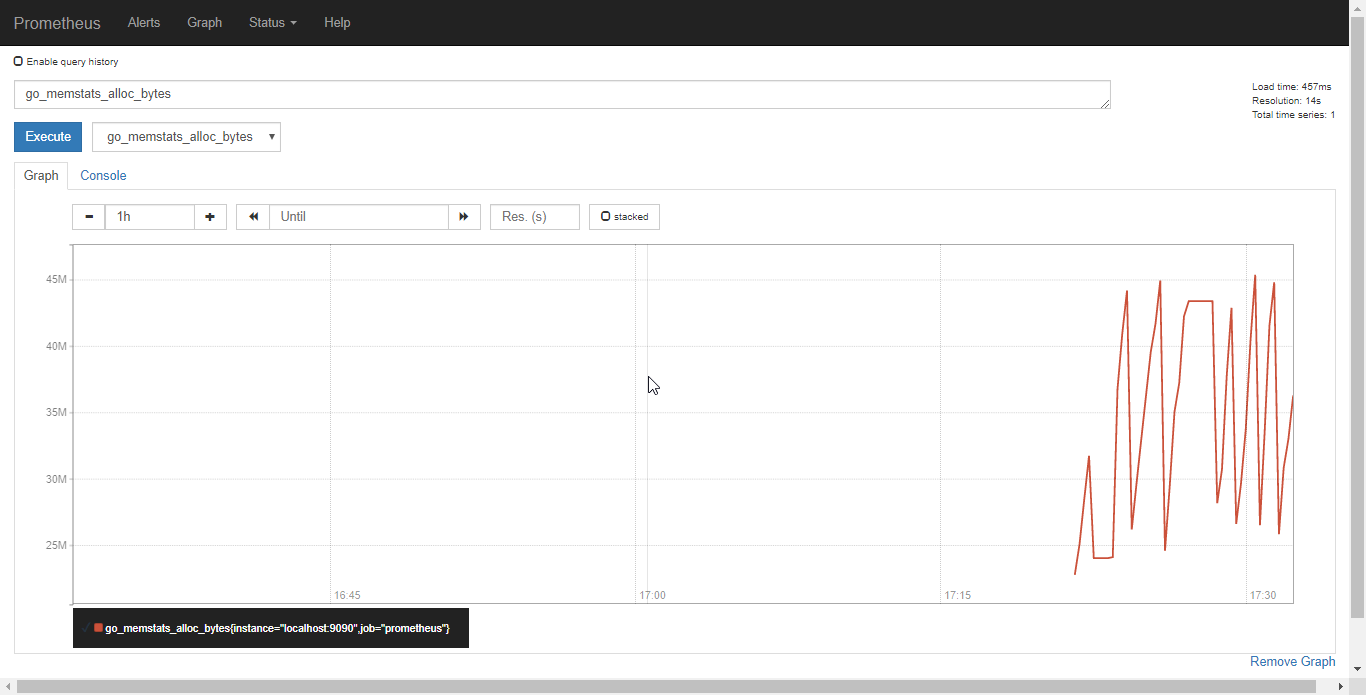
sudo systemctl start prometheus- Prometheus looks like this, when you open by using web server http://your.server.ip:9000

Configuring Prometheus with Grafana
- Now you have to create a Prometheus data source
- Click on the Grafana logo to open the sidebar.
- Click on “Data Sources” in the sidebar.
- Choose “Add New”.
- Select “Prometheus” as the data source.
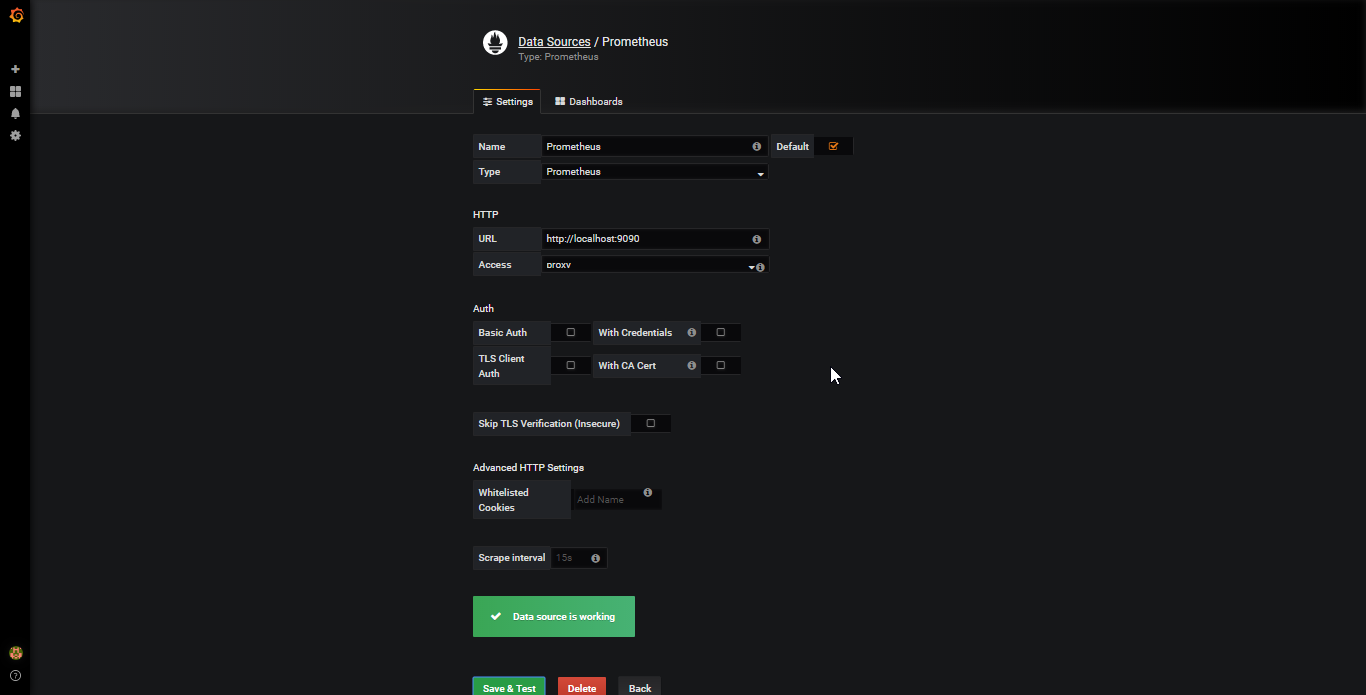
- Set the Prometheus server URL (in our case: http://localhost:9090/)
- Click “Add” to test the connection and to save the new data source.
Your settings should look like this:
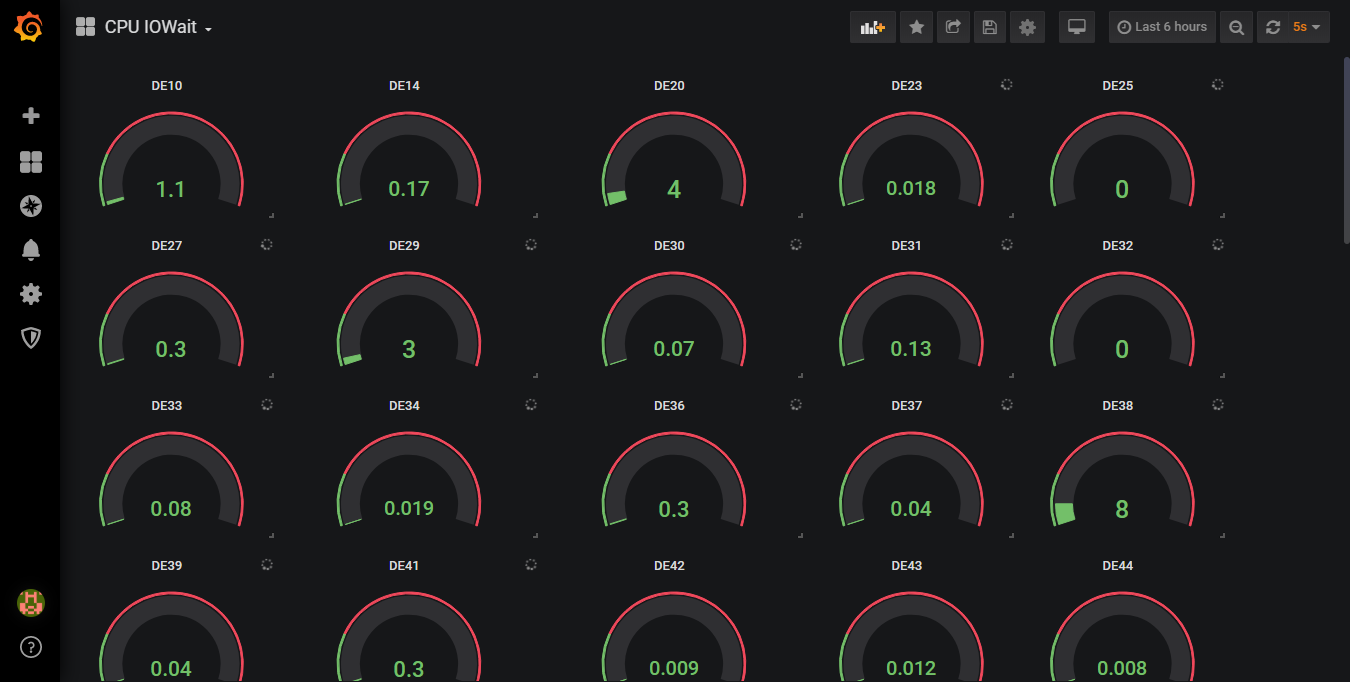
- Here is an example of a Dashboard that uses the CPU usage of our node and presents it in Grafana.
CrownCloud - Get a SSD powered KVM VPS at $4.5/month!
Use the code WELCOME for 10% off!
1 GB RAM / 25 GB SSD / 1 CPU Core / 1 TB Bandwidth per month
Available Locations: LAX | MIA | ATL | FRA | AMS