How to Install Grafana on Ubuntu 23.10
Grafana is an open-source, feature-rich observability and monitoring platform that allows you to visualize and analyze your data through customizable dashboards. It's commonly used for monitoring and observability in various IT and DevOps contexts, helping organizations gain insights into their systems, applications, and infrastructure.
First, check for any pending system upgrade
apt updateAdd the Grafana APT Repository on Ubuntu 23.10
apt install -y gnupg2 curl software-properties-common
curl -fsSL https://packages.grafana.com/gpg.key|sudo gpg --dearmor -o /etc/apt/trusted.gpg.d/grafana.gpg
Install the Grafana CE on Ubuntu 23.10
add-apt-repository "deb https://packages.grafana.com/oss/deb stable main"Install Grafana on Ubuntu 23.10
apt -y install grafanaTo Start and grafana-server
systemctl enable --now grafana-serverOutput:
root@vps:~# systemctl enable --now grafana-server
Synchronizing state of grafana-server.service with SysV service script with /lib/systemd/systemd-sysv-install.
Executing: /lib/systemd/systemd-sysv-install enable grafana-server
Created symlink /etc/systemd/system/multi-user.target.wants/grafana-server.service → /lib/systemd/system/grafana-server.service.
root@vps:~#
Allow Ports on Firewall
apt -y install ufwTo enable the firewall service:
ufw enableTo open the port on the firewall:
ufw allow ssh
ufw allow 3000/tcp
Output:
root@vps:~# ufw allow ssh
3000/tcpRules updated
Rules updated (v6)
root@vps:~# ufw allow 3000/tcp
Rules updated
Rules updated (v6)
root@vps:~#
To restrict access to a specific subnet, use:
sudo ufw allow from yourserver.ip.address/24 to any port 3000Replace the yourserver.ip.address with the actual IP or domain configured on the server.
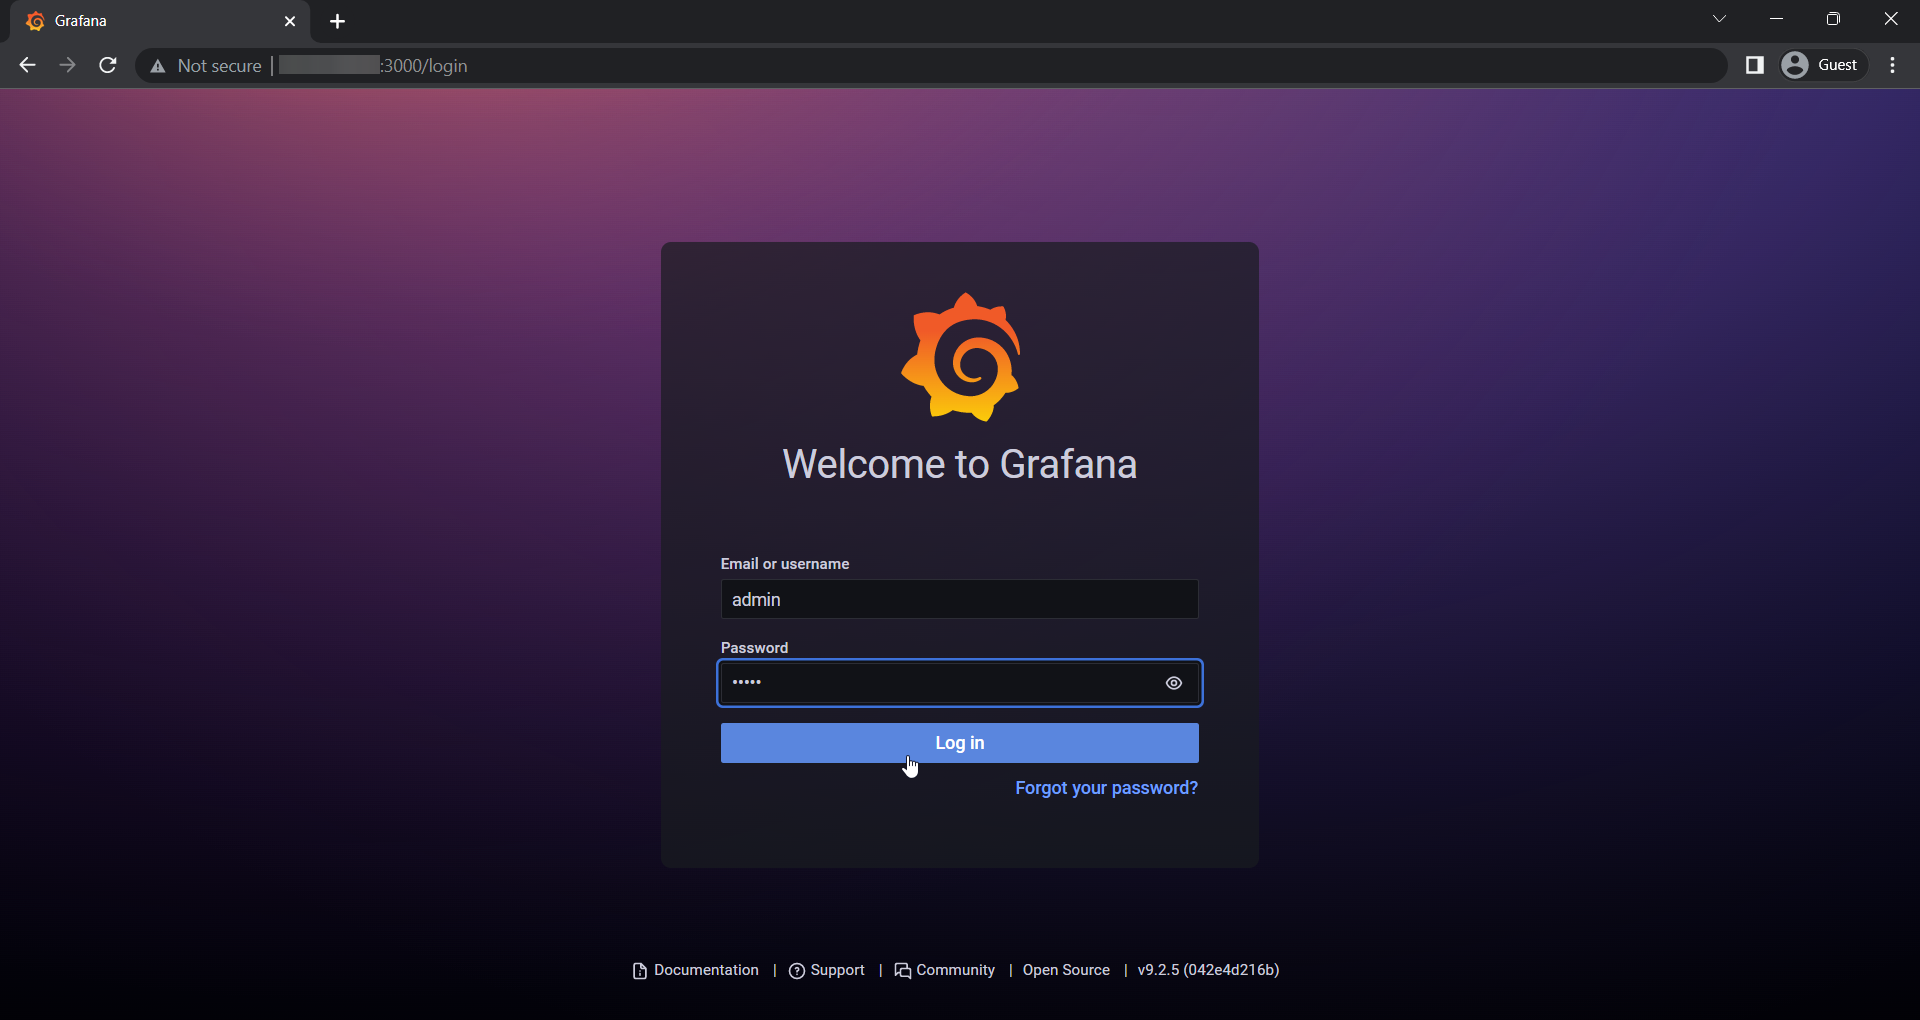
Accessing Grafana
http://server.ip.address:3000/loginReplace the yourserver.ip.address with the actual IP or domain configured on the server.
The default logins are defined as,
Username: admin Password: admin
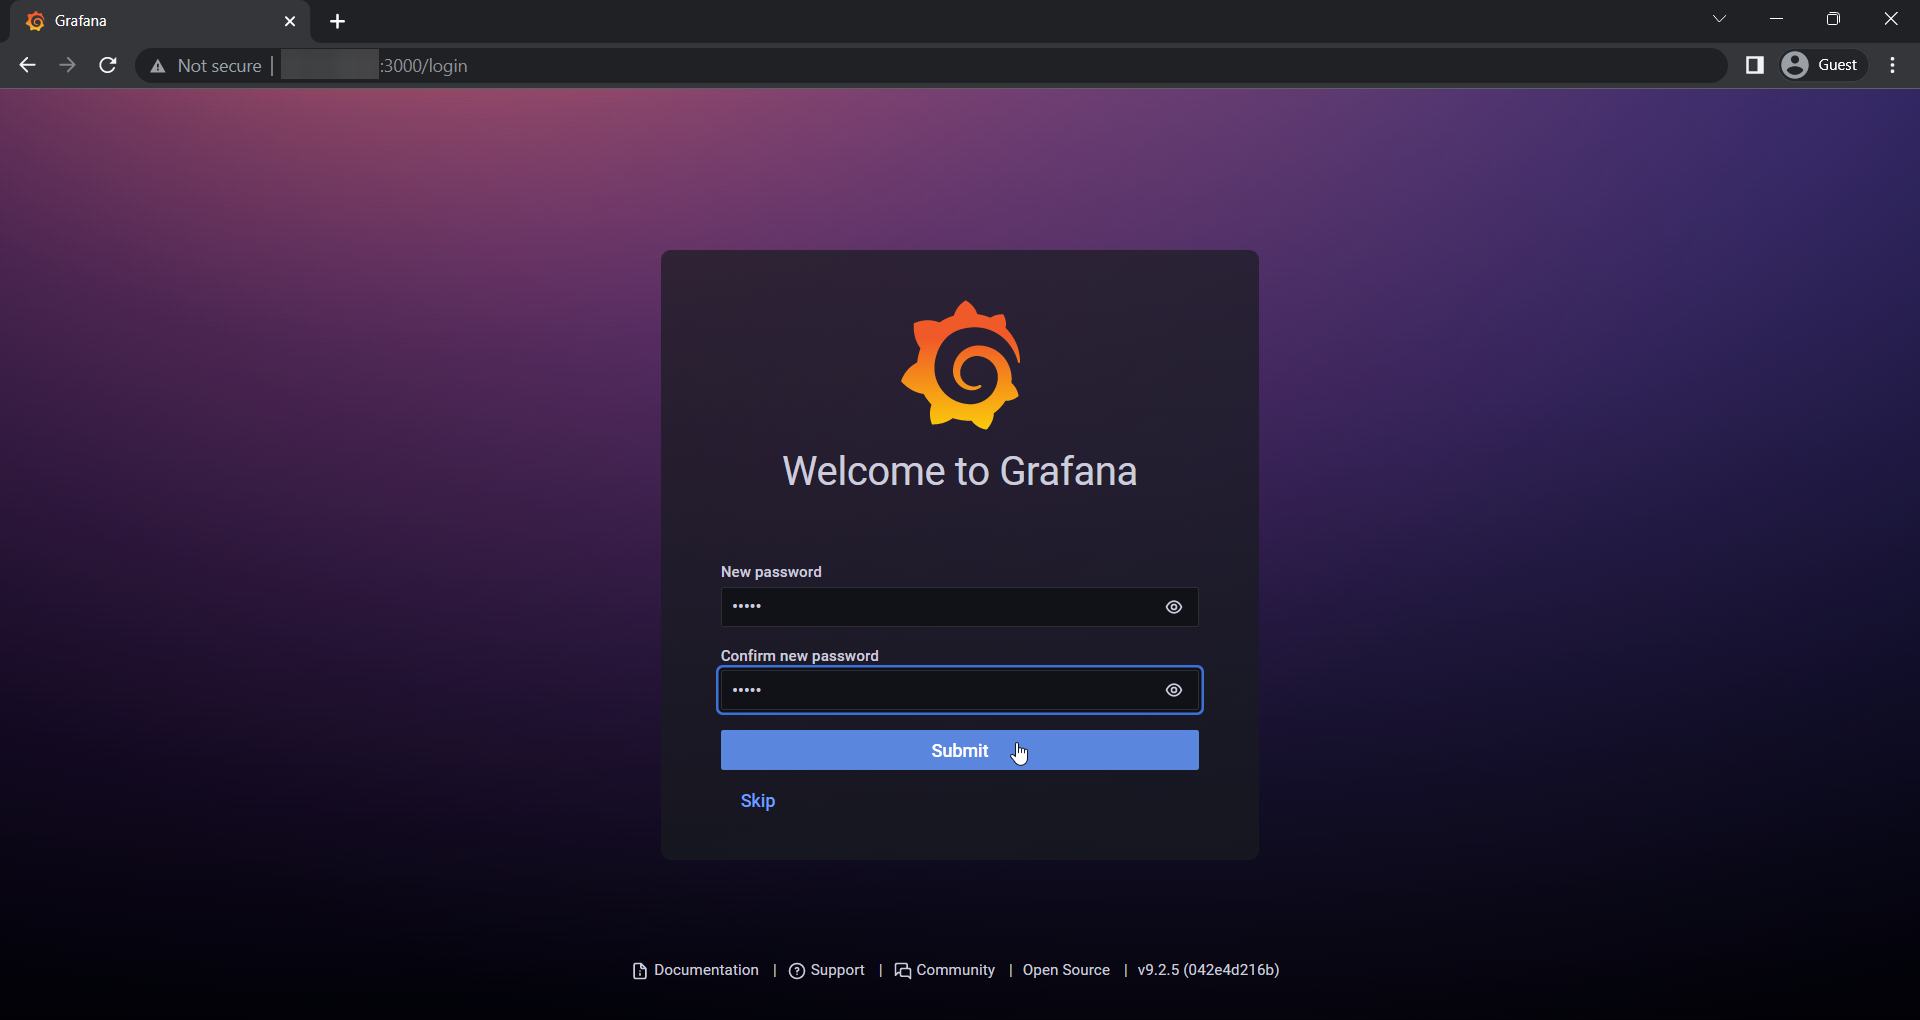
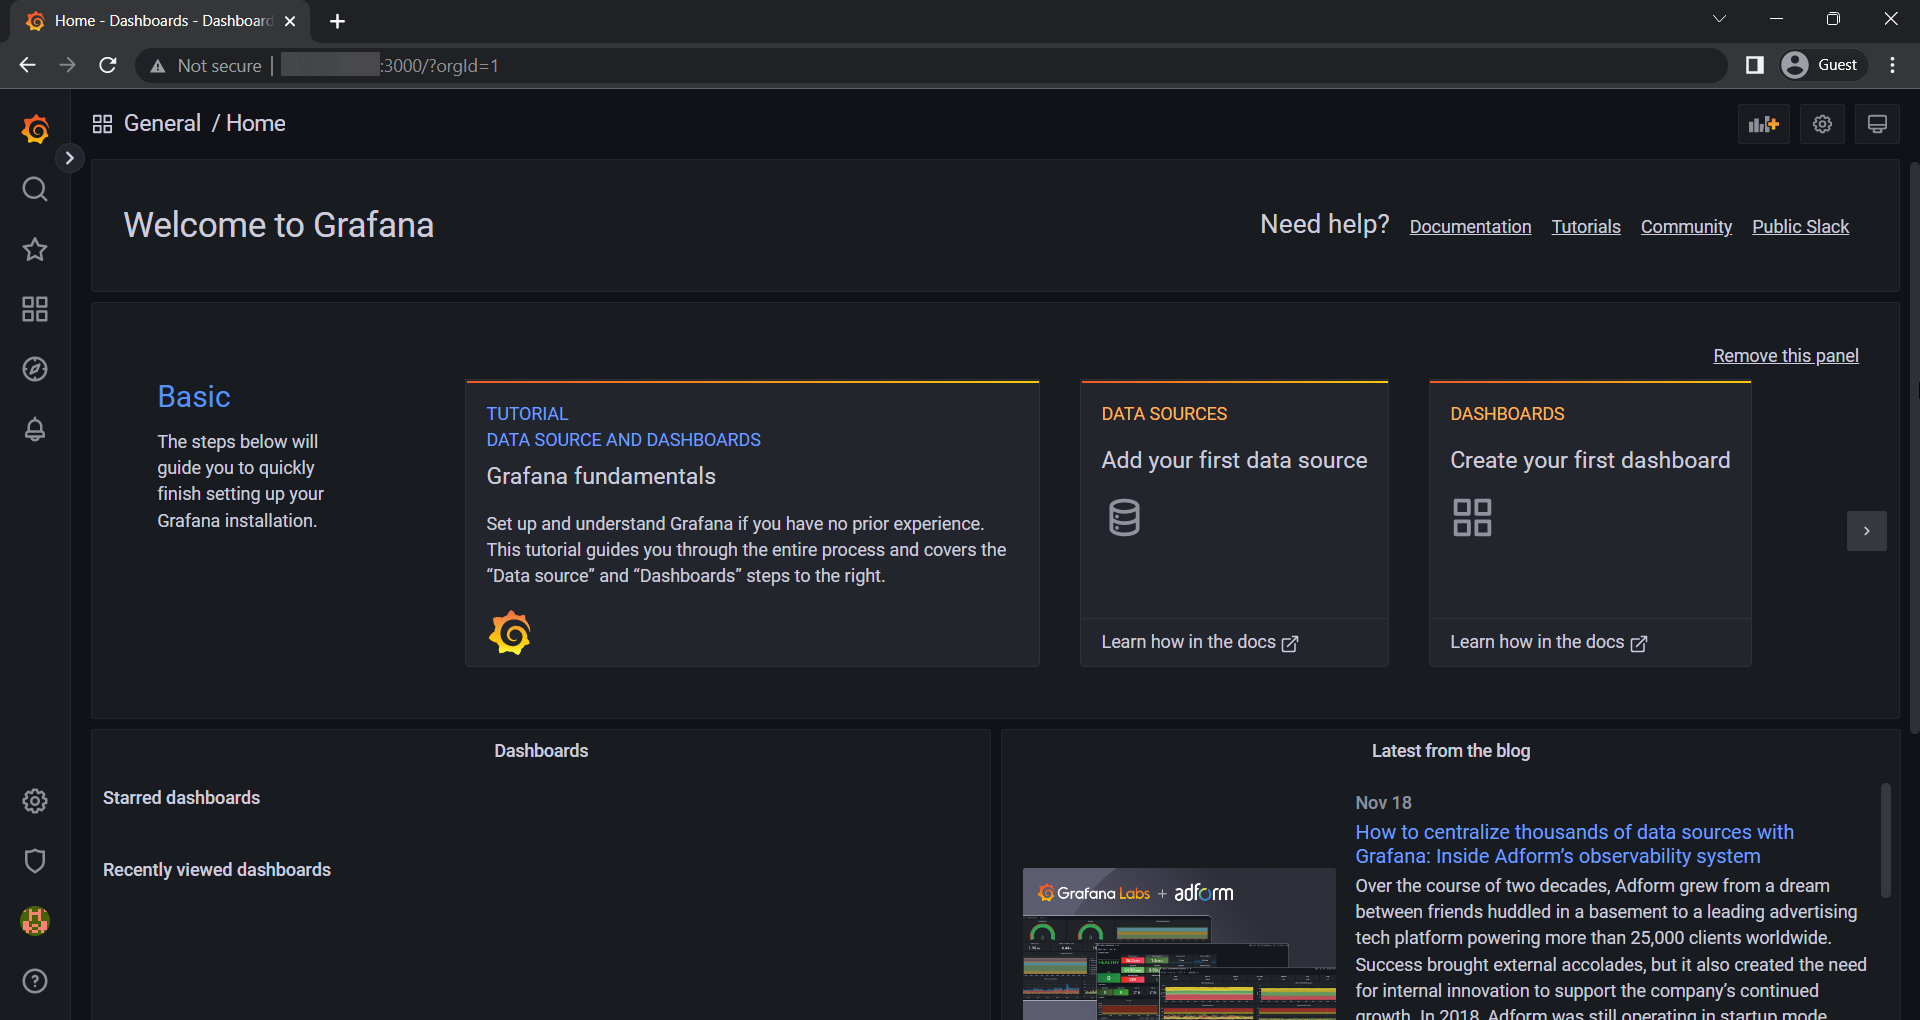
Follow the below steps:


This concludes the Installation and Grafana on Ubuntu 23.10.
CrownCloud - Get a SSD powered KVM VPS at $4.5/month!
Use the code WELCOME for 10% off!
1 GB RAM / 25 GB SSD / 1 CPU Core / 1 TB Bandwidth per month
Available Locations: LAX | MIA | ATL | FRA | AMS